Why does your bus stop timetable answer the wrong question?
A timetable tells people when the bus is due. It rarely gives an undecided passenger a reason to travel. Our print-to-live model uses a QR code to connect physical information with live digital channels, making useful services easier to find and choose.
People search for
In this article
Most people in England made fewer than one local bus trip in 2025. That statistic points to a large group of potential passengers who pass bus stops every day without noticing them.
A traditional bus stop timetable tells people when the bus is due. It does not readily show where the bus goes, how much the journey costs or how long it takes to reach a destination.
A bus stop timetable panel may be the network’s only chance to reach someone who has not yet decided to travel.
A cautionary example worth learning from
Transport for London’s bus spider maps are the UK’s best-known bus stop diagrams. Each map is an individual static file, and approximately 900 versions were in circulation. Fixed files were hard to correct and could not be adapted for a mobile browser. TfL’s open data forum documents the consequence: a file store with more than a thousand maps, but only a few hundred available on the website. In at least one case, a withdrawn route remained on display at the stop, its number crossed out by hand in marker pen.
TfL has since withdrawn some of these maps, citing research that fewer than one per cent of passengers use them. There is little case for retaining a product that almost nobody uses. But the figure describes a product that was often months out of date, available only as a downloaded file and absent from the app most Londoners already use. A diagram that cannot be updated easily or used digitally does not serve passengers.
What stronger international examples show
Singapore’s Land Transport Authority leads its passenger displays with a “Quickest Way To” panel. It is organised by destination, so someone travelling to the hospital can see the fastest bus instead of comparing four timetables. Zurich and Brussels use line weight and colour to show service frequency at a glance.
A print-to-live model that does not need an app
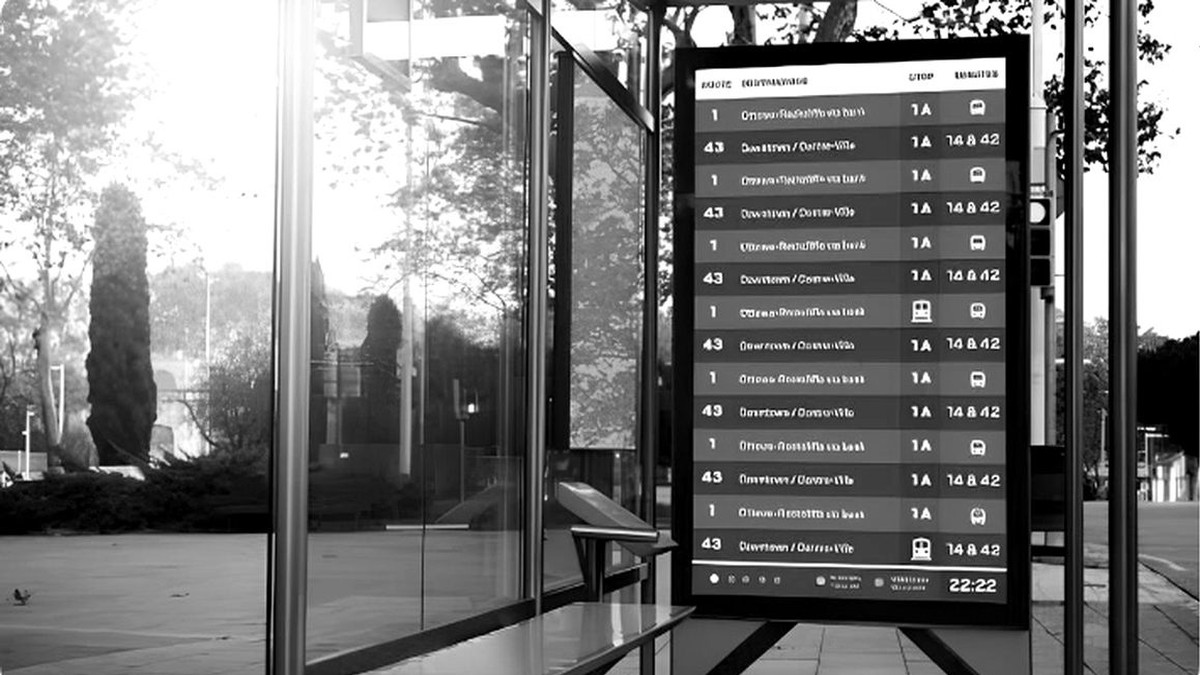
Nationally, the operational foundation already exists. 99% of buses in England use Automatic Vehicle Location (AVL) equipment. 97% of those systems provide a real-time information feed, and 96% of those buses accept contactless payment. A bus stop-specific QR code printed on the panel can open a mobile web page that shows live departures for that stop using an AVL feed. If AVL is integrated, a web page saved to a user’s phone can perform the practical function of a dedicated app. Casual passengers can use it without downloading another app before deciding to travel. That creates an immediate connection with the network.
The opportunity is to grow patronage through a print-to-live design that gives people a reason to engage.
What this looks like on a route
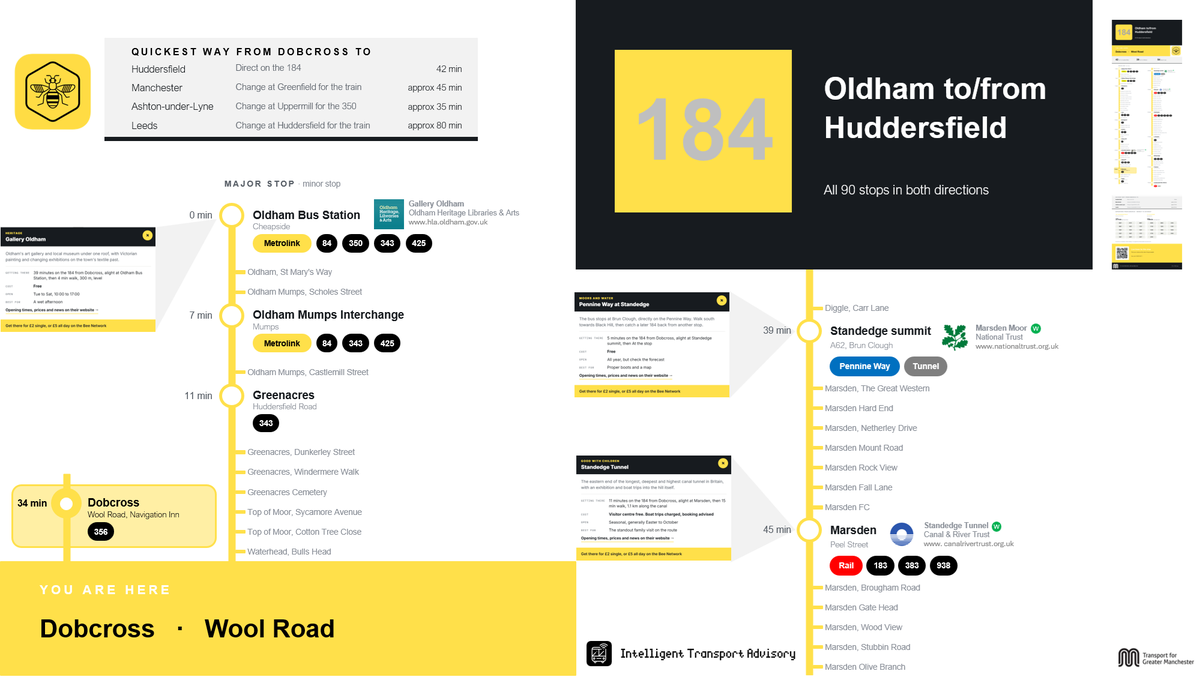
We developed the design for the 184 between Oldham and Huddersfield to show how it could work. The Bee Network runs the 19-mile route, which has 90 stops and an hourly service. The printed panel fits the standard case size already in use and organises all 90 stops by destination before service.
The design can form an interactive web page that uses AVL to show a bus’s position on the route. The route example includes tourism, places of interest and events to attract passengers.
What to specify
| Design principle | What it requires |
|---|---|
| Design for the undecided passenger | Give a readable reason to travel that can be understood from a distance, alongside departure information |
| Answer where before when | Put named destinations and landmarks ahead of timetable detail |
| Make frequency clear at a glance | State it in words and large numerals so passengers do not have to find it in a grid |
| Bridge print to live without requiring an app | Use a stop-specific code that takes users to a validated web page for that stop |
| One governed content record | Render every channel from a single source rather than authoring each surface separately |
Useful questions
Before proceeding, ask:
- Does your current bus stop information answer any question other than “when is the bus due”?
- If you tested your real-time data feed today, would you trust its accuracy?
- Who owns the content record for your bus stop information?
- Would your organisation know if a printed panel was showing a withdrawn route right now?
More on Digital Passenger Experience